With the Bitcoin price nearing the $65k mark, the meme coin segment is gaining bullish momentum as the market cap nears $53B. Amid the top performers, the Mog coin (MOG) and Cat in a Dogs World (MEW) are ready for a massive bull run.
Will these trending meme coins hit a new all-time high as the broader market recovers? Read our MOG and MEW price analysis to learn more.
Top Performing Meme Coins To Buy:
Mog Coin (MOG)
With a market cap of $31.61 million, MOG coin is a rising meme coin, which has increased by 8.55% in the past 24 hours. With nearly a 20% surge in the last seven days, the meme coin is currently trading at $0.000002086.
Tradingview
In the daily chart, the MOG token reveals a rounding bottom reversal and five consecutive bullish candles. Starting with a morning star pattern near the 50-day EMA, the meme coin has increased by almost 60% from its 7-day low at $0.0000013320.
With a streak of consecutive bullish candles, the meme coin is on the verge of hitting the rounding bottom’s neckline at $0.0000023544. Based on the Fibonacci levels, the neckline coincides with the 100% Fibonacci level or the previous swing high.
Furthermore, the 50-day and 200-day EMA maintain a bullish alignment and continue to surge and provide dynamic support. Even the technical indicator daily RSI line shows a surge in bullish momentum as it enters the overbought zone.
A bullish breakout of the rounding bottom pattern will likely hit $0.000003279 or $0.00000499 at 1.272 and 1.618 Fibonacci levels, respectively.
Will the Meme coins surge this October? Find out now in Dogecoin price prediction, the biggest meme coin in the industry that will shape the future rally.
Cat in a Dogs World (MEW)
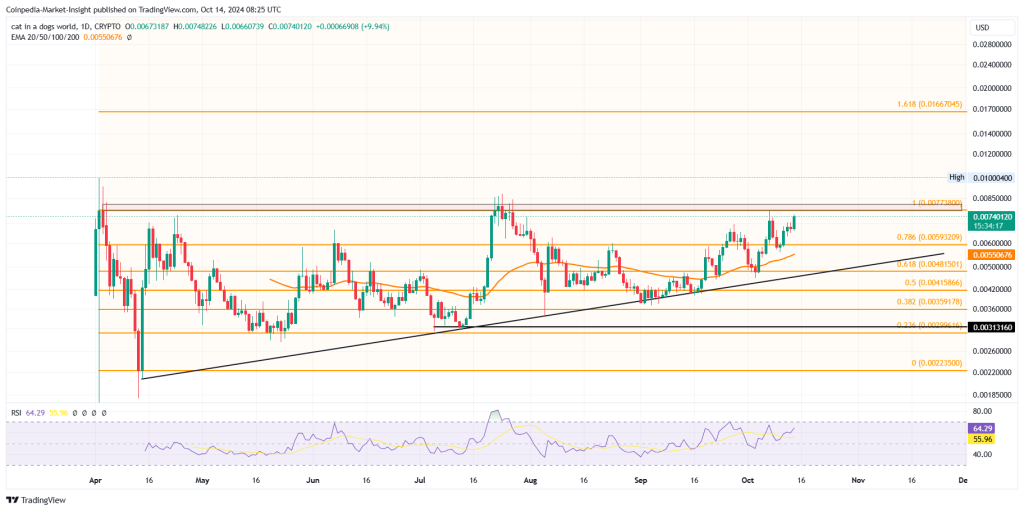
With a 16.02% surge in the past seven days, the bullish trend in the Cat in a Dog World meme coin continues with an 8.30% surge in the last 24 hours. With a market cap of $657.96 million, the MEW token is currently trading at $0.007395.

Tradingview
In the daily chart, the MEW token reveals an ascending triangle pattern with a long-coming support trend line. The glass ceiling of the ascending trend line resides at the 100% Fibonacci level at $0.007738.
Currently, the bullish engulfing candle with an intraday gain of 9.74% is approaching the overhead resistance. Further, the daily RSI line is close to reaching the overbought zone as the 50-day EMA maintains a positive trend.
Based on the Fibonacci levels, a bullish breakout will likely head the 1.618 Fibonacci level at $0.016670. However, for the short term, the 1.272 Fibonacci level at the psychological mark of $0.010 seems more realistic.
Credit: Source link


