The Trump meme coin OFFICIAL TRUMP has surged into the crypto spotlight, recently climbing into the top 20 cryptocurrencies by market capitalization just three days after its debut. With an impressive rally, the coin witnessed an approximate 670% gain from its launch date to its all-time high around the $75.35 mark. The token trades at $49.24 at press time, up nearly 12% in the last 24 hours. This rise has ignited speculation that the coin may breach the $100 mark in the coming days.
TRUMP’s Price Outlook: $100 Target in Sight
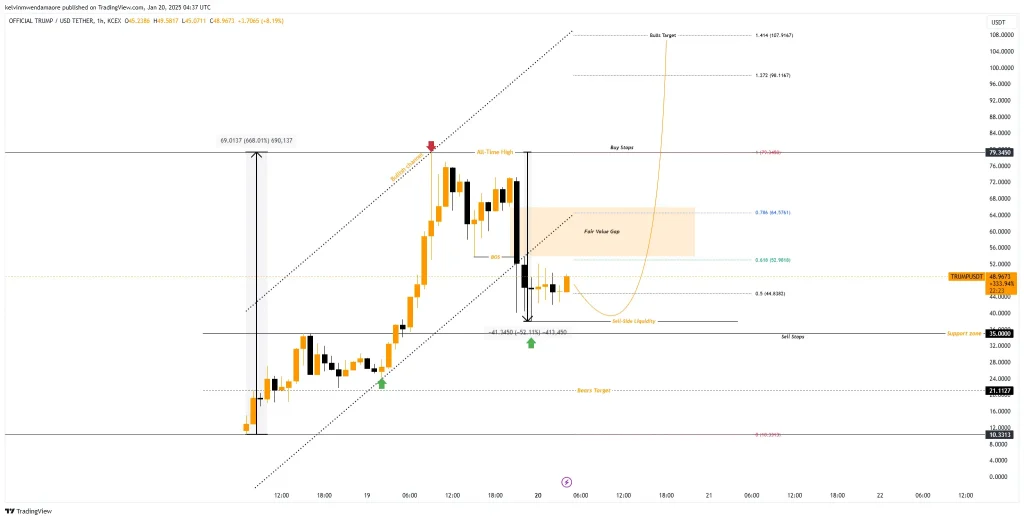
The 1-hour chart depicts the Trump/USDT trading pair, showcasing a highly volatile market with heightened price action. Historically, the price experienced a strong bullish rally, surging approximately 668% to reach its all-time high. This rally was driven by intense buying pressure within a well-defined bullish channel, but the ATH acted as a resistance point, triggering a reversal and subsequent bearish momentum.
A Break of Structure (BOS) below the ATH confirmed a shift in trend as sellers gained control in the short term. Following this downside momentum, a critical Fair Value Gap (FVG), between $53.86 and $66, was formed, highlighting an area of inefficiency where TRUMP’s price may retrace before continuing its movement.

Below this, a sell-side liquidity zone around the $38 level indicates an area where stop-loss orders may reside, making it a probable target for price clearance. Meanwhile, the $35 support zone aligns with historical buyer activity and serves as a psychological floor. As of this publication, the TRUMP’s token price trades around the $48 mark, reflecting a correction phase following the ATH.
However, Fibonacci retracement levels suggest key pivot points, with the 0.618 – 0.786 zone ($52.98 – $64.57) aligning with the FVG as a critical resistance area. If the price retraces into this zone and finds buyers, it could resume its bullish momentum, potentially targeting $98.11 (1.272 Fibonacci) and $107.91 (1.414 Fibonacci).
Conversely, failure to sustain current levels could cause the cryptocurrency’s price to drop further into the liquidity zone or even test historical lows near $10.33 or $8.00. In the near term, the price is likely to oscillate within the $44.88 – $64.57 range, consolidating before determining its next trend.
TRUMP’s Indicators Hint at an Impending Bullish Outlook
The Chaikin Money Flow (CMF) indicator, set at 20 periods, shows a value of 0.21, indicating positive capital inflows and intense buying pressure. This aligns with the observed price recovery and supports a bullish outlook t. Sustaining momentum above 0.20 will be crucial for continued market strength.
Similarly, the Relative Strength Index (RSI), set to a 14-period close, currently reads 59.59, just below the overbought threshold of 70. This suggests the market has regained strength following the recent sell-off but remains within a neutral-to-bullish range. The RSI’s upward trajectory indicates the possibility for further gains before reaching overbought levels, likely hitting the $100 mark.
Also Read: Cardano’s ADA Correction Complete, Next Stop: $6?
Credit: Source link


