Join Our Telegram channel to stay up to date on breaking news coverage
The Solana price prediction shows that SOL could renew the bullish trend after testing the support level of $150.35 today.
Solana Prediction Statistics Data:
- Solana price now – $154.63
- Solana market cap – $72.18 billion
- Solana circulating supply – 469.75 million
- Solana total supply – 586.57 million
- Solana Coinmarketcap ranking – #5
Early investment in Solana (SOL) has proven incredibly rewarding, with its price surging by 30,634.55% from its all-time low of $0.5052 in May 2020. Although it’s currently down 40.3% from its all-time high of $260.06 in November 2021, the token’s recent 24-hour performance, ranging from $150.91 to $158.72, still showcases significant growth potential. This highlights the advantages of getting involved early in a crypto project.
SOL/USD Market
Key Levels:
Resistance levels: $180, $190, $200
Support levels: $130, $120, $110
According to the daily chart, Solana (SOL) shows a promising technical structure that is setting the stage for potential future price movements. Recently, the price formed a double-bottom pattern, a classic bullish reversal indicator, suggesting that the market may be poised for an upward breakout. A significant breakout occurred two days ago, continuing through the weekend. Solana has since approached a critical resistance zone between $157 and $159, with a daily high at $161, a region where heavy trading volume has historically taken place. However, successfully clearing this resistance could unlock the next leg of the uptrend.
Solana Price Prediction: What Could Be the Next Direction for Solana Price?
The daily chart shows that Solana has been consolidating between $122 and $164 for an extended period. While some may view this as a sign of indecision, it is often a bullish signal when an asset consolidates after an uptrend. This sideways price movement allows the market to digest previous gains, building momentum for a potential breakout. Historically, breaking through the $164 – $166 resistance zone could lead to sharp rallies, with previous breakouts pushing the price toward the resistance level of $180, $190, and $200, respectively. A similar move could occur if this resistance is cleared again.
Meanwhile, traders can see that the daily movement remains in the hands of the bearish but the 9-day moving average is likely to cross above the 21-day moving average, suggesting a breakout above the channel. Therefore, a break into the positive side may most likely push the coin above the upper boundary of the channel, while a drop toward the lower boundary of the channel may lead to the supports of $130, $120, and $110 respectively.
SOL/BTC May Break to the North
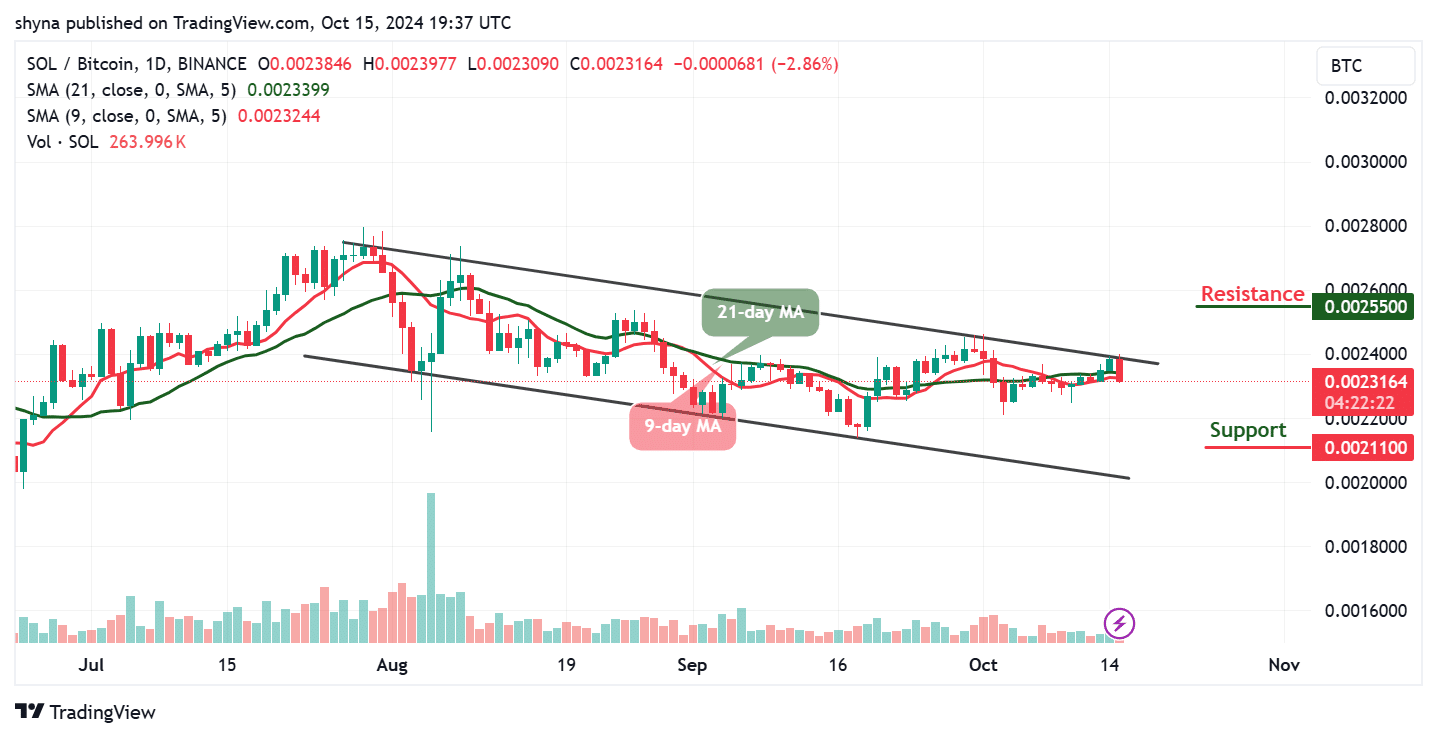
When comparing Solana to Bitcoin (SOL/BTC) on the daily chart, early signs of bullish divergence are starting to appear. Although Solana has yet to outperform Bitcoin in a significant way, the price action suggests that Solana could begin to gain strength relative to Bitcoin. The daily chart indicates that Solana’s performance against Bitcoin is stabilizing, and any additional momentum could lead to a breakout in the SOL/BTC pair.

Meanwhile, should the sellers return heavily to the market, the Solana price may drop to the support of 2110 SAT and below. Now, the technical indicator 9-day moving average as the market could face upward movement in the next positive direction while the resistance level could be located at 2550 and above.
However, @0xShinichi shared with his followers on X (formerly Twitter) that $SOL has been consolidating within a range for nearly six months, much like Bitcoin. Meanwhile, meme coins have been experiencing significant surges. He encouraged followers to imagine the potential when $SOL finally breaks out of its current range.
$SOL has been ranging for almost 6 months similar to Bitcoin yet the meme coins pump like crazy.
Imagine…just imagine when it breaks out of this range 🧐 pic.twitter.com/R6ggzgjfZS
— Shinichi (@0xShinichi) October 15, 2024
Alternatives to Solana
In the short term, for Solana (SOL), the likelihood of an immediate breakout remains uncertain. While the daily chart reflects a modest increase in trading volume, the current momentum is not yet strong enough to confidently push through the $164-$166 resistance. Solana may continue to consolidate for a bit longer before a significant breakout occurs. Nevertheless, the cryptocurrency market is experiencing a bullish phase, with strong momentum across various assets. Meme coins, in particular, are gaining traction, and Pepe Unchained is emerging as a potential standout in this space. The token has already raised over $19.7 million in presale activity, signaling high interest from investors.
Pepe Unchained Could Be Next To Soar
Investor interest in Pepe Unchained is bolstered by large transactions, including a notable $61,000 purchase by a whale investor. Daily net inflows of approximately $250,000 further indicate strong demand for the token. Whale accumulation is often seen as a bullish indicator, as it suggests confidence from big players in the market, adding credibility to the token’s potential for future gains.
Visit Pepe Unchained
Related News
Most Searched Crypto Launch – Pepe Unchained
- Layer 2 Meme Coin Ecosystem
- Featured in Cointelegraph
- SolidProof & Coinsult Audited
- Staking Rewards – pepeunchained.com
- $10+ Million Raised at ICO – Ends Soon
Join Our Telegram channel to stay up to date on breaking news coverage
Credit: Source link


