Join Our Telegram channel to stay up to date on breaking news coverage
The Kyber Network price prediction shows that KNC manages to maintain its position as the bulls maintain the desire to shoot to the upside.
Kyber Network Prediction Statistics Data:
- Kyber Network price now – $0.93
- Kyber Network market cap – $153.7 million
- Kyber Network circulating supply – 164.8 million
- Kyber Network total supply – 223.3 million
- Kyber Network Coinmarketcap ranking – #185
KNC/USD Market
Key Levels:
Resistance levels: $1.15, $1.20, $1.25
Support levels: $0.70, $0.65, $0.60
After being locked within the 9-day and 21-day moving averages, KNC/USD still undergoes a much-needed break to the positive side by posting a tremendous gain of over 7.66%, with the coin trying to cross above the upper boundary of the channel.
Kyber Network Price Prediction: Where will KNC Price Go Next?
The Kyber Network price may continue with the bullish movement after touching the daily high of $0.95 during the European session today. The coin is now roaming above the 9-day and 21-day moving averages to continue a movement toward the resistance level of $1.00. Looking at the daily chart, traders can see the trading volume rising as this may cause the bulls to increase the buying pressure.
On the contrary, if KNC /USD slides below the moving average, it could fall and face the lower boundary of the channel which could hit the supports at $0.70, $0.65, and $0.60. But as the Relative Strength Index (14) moves above the 60-level, crossing into the overbought region may cause the coin to reach the potential resistance levels at $1.15, $1.20, and $1.20 respectively.
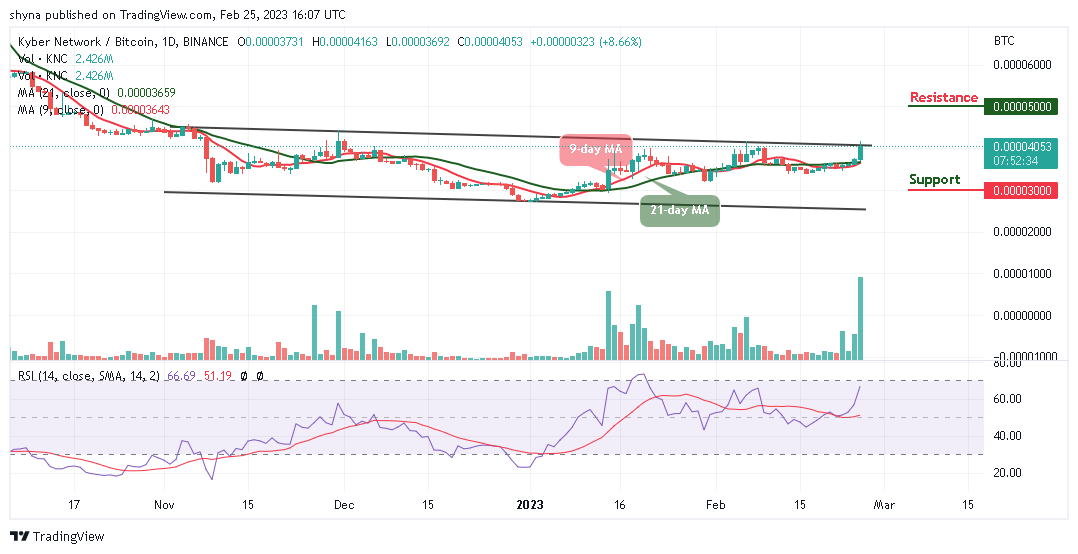
Against Bitcoin, the Kyber Network (KNC) spikes to the north as the coin moves above the 9-day and 21-day moving averages. On the contrary, if the sellers step back into the market, KNC/BTC could fall toward the nearest support level of 3800 SAT. In contrast, the critical support level could be located toward the lower boundary of the channel at 3000 SAT and below.

However, as the coin heads to the upside, any bullish movement may push the coin above the upper boundary of the channel which could find the resistance level of 5000 SAT and above. Meanwhile, the coin is currently changing hands at 4053 SAT and any spike in volatility may occur as the Relative Strength Index (14) crosses above the 60-level.
Kyber Network Alternatives
The Kyber Network price is in the hands of the bulls as the coin trades above the moving averages. However, due to the current bullish movement, the coin may soon cross above the upper boundary of the channel and the more the bulls pressurized the bears, the higher the coin would reach. Nevertheless, The FGHT token presale has been successful as it raises $4.72 million in the past few weeks. This puts the Firght Out token well on its way to hitting its $5 million target before the expiration of the presale.
Fight Out (FGHT) – Move to Earn in the Metaverse
- CertiK audited & CoinSniper KYC Verified
- Early Stage Presale Live Now
- Earn Free Crypto & Meet Fitness Goals
- LBank Labs Project
- Partnered with Transak, Block Media
- Staking Rewards & Bonuses
Join Our Telegram channel to stay up to date on breaking news coverage
Credit: Source link


