Este artículo también está disponible en español.
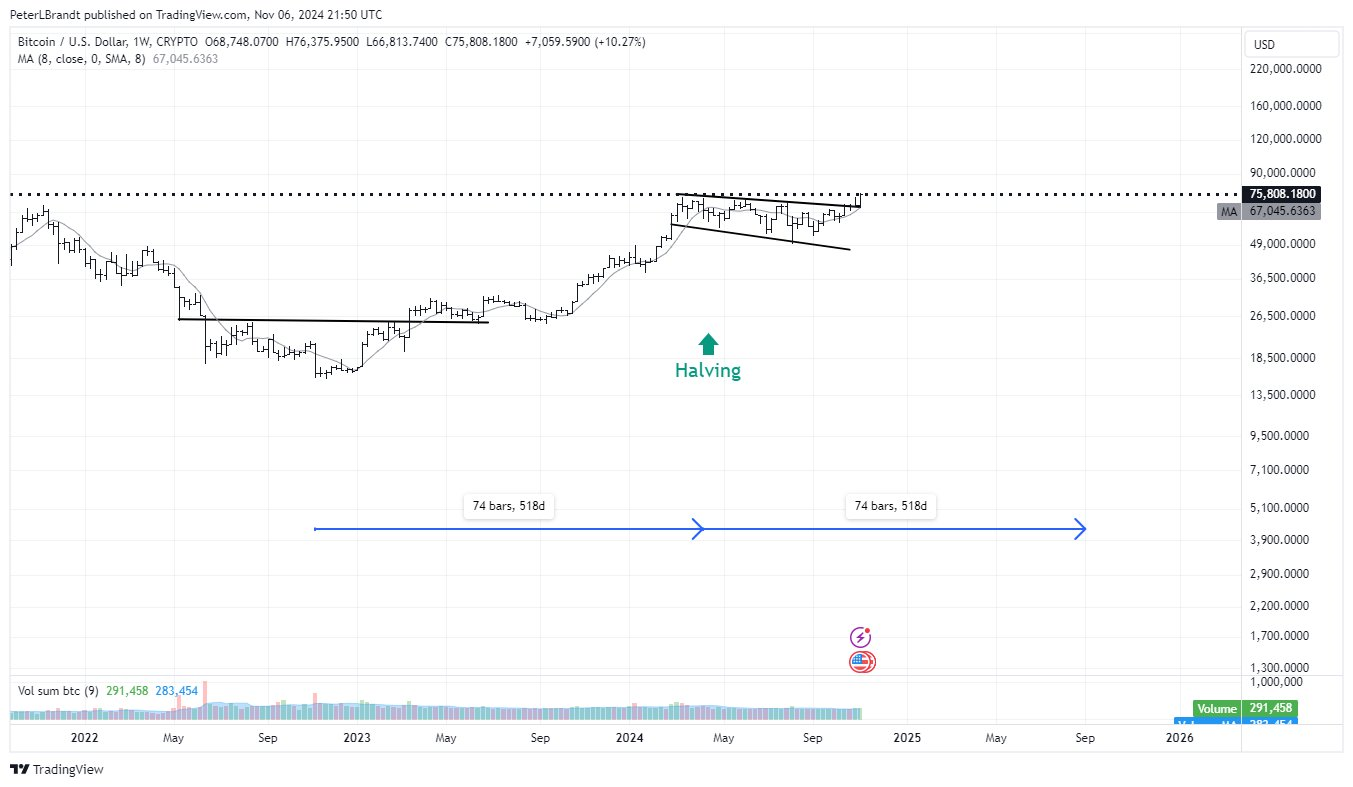
Legendary trader Peter Brandt, with nearly five decades of experience in trading since 1975, has shared a bullish forecast for the Bitcoin price trajectory in 2025. Taking to X, Brandt stated: “Bitcoin $BTC is now in the sweet spot of the bull market halving cycle that should top in the $130k to $150K range next Aug/Sep. I measure cycles differently than most.”
How High Can Bitcoin Go In 2025?
Brandt’s analysis is rooted in the historical patterns observed in Bitcoin’s halving cycles. His chart, covering Bitcoin’s price action from early 2022 with projections into 2026, highlights two significant periods of 518 days each. These periods represent critical phases in Bitcoin’s market behavior, representing the cyclical nature of its price movements.
A notable technical pattern identified in his chart is the breakout from a broadening wedge. This formation, characterized by diverging support and resistance lines, suggests increasing market volatility as prices make progressively higher highs and lower lows. The successful breakout from this pattern is considered a strong bullish signal.
Related Reading
In a detailed blog post from June titled “The Beautiful Symmetry of Past Bitcoin Bull Market Cycles,” Brandt elaborated on the significance of halving events. He observed that the halving dates have “represented the half-way points of past bull market cycles,” showing an almost perfect symmetry within these cycles. Specifically, the number of weeks from the start of each bull market cycle to the halving dates has been nearly equal to the number of weeks from the halving dates to the subsequent bull market highs.
Based on this symmetrical pattern, Brandt posits that if the sequence continues, “the next bull market cycle high should occur in late Aug/early Sep 2025.” He suggests that the highs of past bull markets align well with an inverted parabolic curve, and if this tendency persists, “the high of this bull market cycle could be in the $130,000 to $150,000 range.”
Related Reading
Despite his optimistic projection, Brandt maintains a cautious stance. He emphasizes that “no method of analysis is fool-proof” and admits to avoiding being “dogmatic about any idea.” While this view is his preferred analysis, he acknowledges it is not his only interpretation. Brandt notes that he continues to place a 25% probability that Bitcoin’s price has already topped for this cycle. Should Bitcoin fail to make a decisive new all-time high and decline below $55,000, he would raise the probability of an “Exponential Decay.”
The crypto community has been actively engaging with Brandt’s analysis. Popular crypto analyst Astronomer (@astronomer_zero) responded on X, agreeing with Brandt’s top estimation and highlighting the importance of accurately calling the market top. Astronomer remarked: “I think you’re spot on with that top estimation Peter! As for calling the bottom, now it is our duty to call the top ideally in one single try. The terminal price does that very well. I have 6 other metrics in place. If they all line up, it is a sell. Location at $160,000.”
In a further exchange, an X user inquired about the implications for the Bitcoin to gold (BTC/GLD) ratio, suggesting it might imply a much higher price. Brandt responded, “Eventually, yes. But let’s take one step at a time without become too dogmatic.”
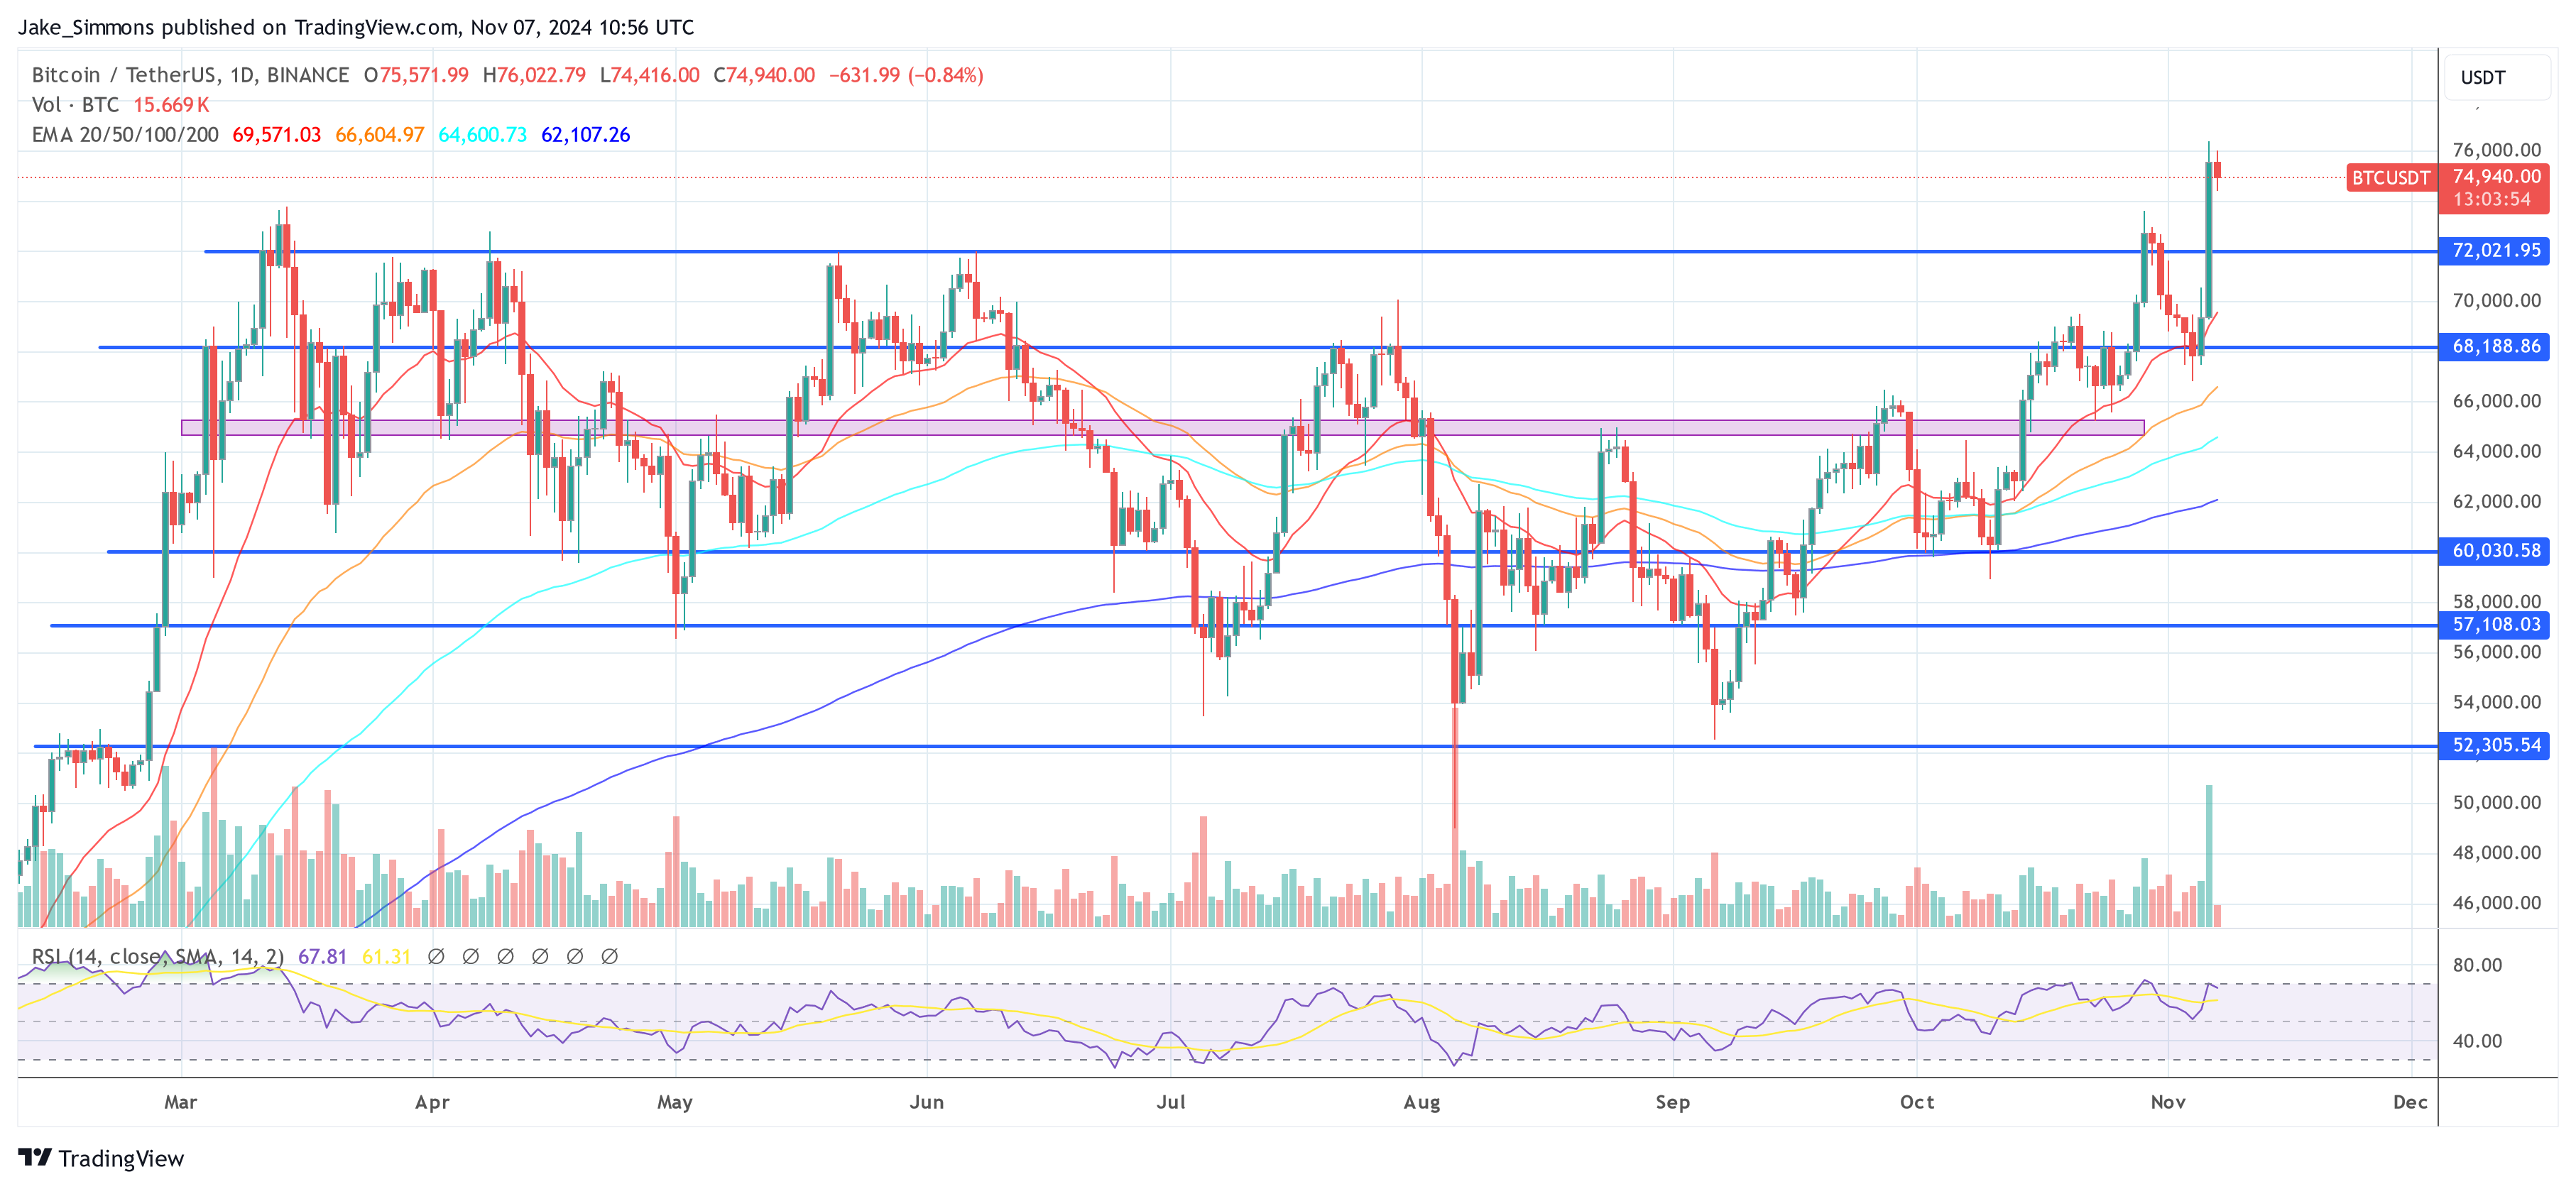
At press time, BTC traded at $74,940.

Featured image created with DALL.E, chart from TradingView.com
Credit: Source link


