With the crypto altcoin market cap excluding Bitcoin falling down to $909.91 billion, Ethereum and Solana witness a major crash. The altcoin market has dropped by nearly 7% in the past three days, with Ethereum and Solana approaching crucial support levels.
Will the growing bearish influence in the crypto market result in a major crash in the top altcoins like Ethereum and Solana? Let’s find out in Coinpedia’s latest SOL and ETH price action analysis. Find out the next reversal spot or the downside risk.
Solana Crashes Under $170
In the daily chart, the Solana price action showcases a bullish failure to sustain dominance above the $180 mark. This results in a three-day crash, accounting for nearly a 10% drop, with an evening star formation at the $180 mark.
Tradingview
Currently, it is testing a crucial support level near the $164 level as it trades at $165.69. However, the sudden surge in selling pressure has led to a bearish crossover in the MACD and signal lines.
If the bearish continuation in the Solana continues below the $164 support level, the 50-day and 200-day EMA are two dynamic average lines that could act as a reversal spot. The dynamic averages line are present at $156 and $145 respectively.
Curious if Solana will reach $500 in 2024? Find out now in Coinpedia’s Solana Price Prediction.
Ethereum’s Critical Local Support at Risk
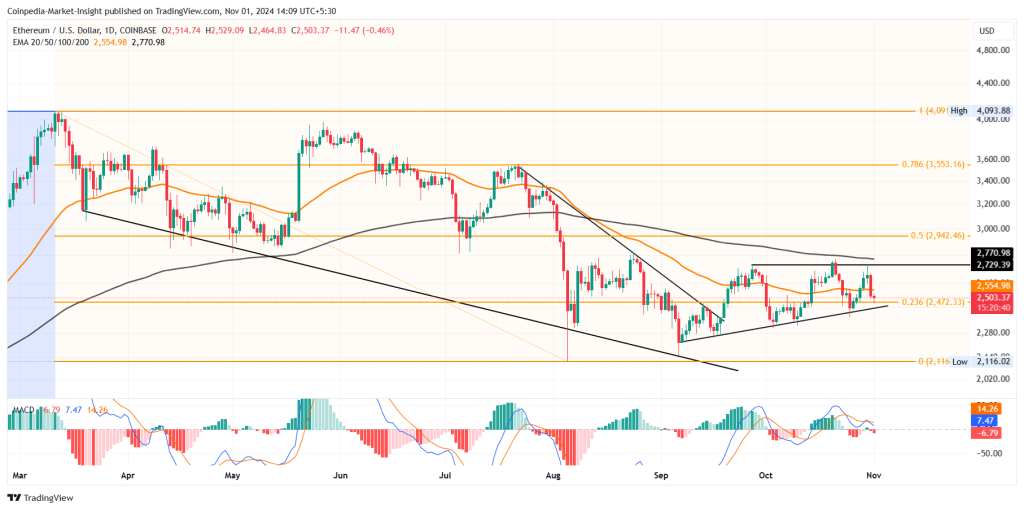
Following the recent falling wedge breakout rally, the higher low formation in ETH continues. Despite the recent market crash, accounting for a 5.29% drop in ETH in a single day, the uptrend sustains.
However, the ETH price fails to surpass the $2,730 resistance level and breaks below the 50-day EMA. Currently, the ETH price is struggling to get support from a local support trendline, and the 23.60% Fibonacci level is at $2,472.

Tradingview
The intraday candle showcases a Doji formation as ETH trades at $2,505. With the Doji candle, the chances of a Morning Star reversal to continue the bullish trend have increased to some extent.
However, the bearish crossover in the MACD and signal lines warns of a negative continuation. Using the Fibonacci retracement tools, the breakout of the $2,730 resistance crossing above the 200-day EMA will likely challenge the 50% Fibonacci level close to the $3,000 psychological mark. However, a breakdown below the local support trendline will put the $2,225 support and $2,160 support at risk.
Credit: Source link


