
Amid the ongoing market reversal, Brett (BRETT), a meme coin that recently gained massive attention from the crypto community with an impressive price surge, is again poised for a significant upside rally. BRETT, the official mascot of the Base Chain, recently gave a breakout from a bullish price action pattern and has shifted the sentiment to an uptrend.
BRETT Technical Analysis and Upcoming Levels
According to the expert technical analysis, BRETT appears bullish after recently breaking out from a descending trendline and a bullish inverted Head-and-Shoulders pattern. Additionally, it has successfully retested the neckline and is now heading in an upward direction.
Based on the price action and BRETT’s daily chart, there is a strong possibility that the meme coin could soar by 40% to reach the $0.15 level in the coming days. Additionally, if the sentiment persists, it could rally another 30% to reach the $0.20 level.
BRETT’s Relative Strength Index (RSI) suggests a significant upside rally, as its value currently lies in oversold territory.
BRETT’s On-Chain Metrics
Despite the bullish technical analysis, BRETT’s on-chain metrics indicate that traders are currently exiting their positions or their positions were liquidated during the recent price correction. According to the on-chain analytics firm Coinglass, its open interest has dropped by 8% over the past 24 hours.
As of now, the major liquidation levels are near $1.055 on the lower side and $1.083 on the upper side, with traders over-leveraged at these levels, according to Coinglass data.
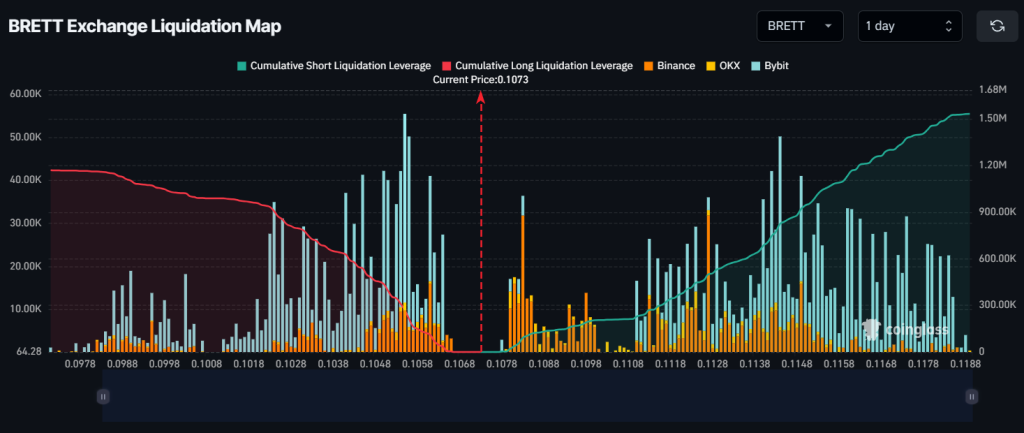
If the market sentiment remains bullish and the price rises to the $0.1083 level, nearly $91,640 worth of short positions will be liquidated. Conversely, if the sentiment shifts and the price drops to the $1.055 level, approximately $268,850 worth of long positions will be liquidated.
Combining these on-chain metrics with technical analysis, it appears that bears are currently in control, though BRETT’s daily chart still looks bullish. According to the chart, if BRETT holds above the $0.0949 level, the bullish outlook will remain intact; otherwise, it will fail.
Current Price Momentum
Currently, BRETT is trading near $0.1073 and has experienced a price drop of 2.65% over the past 24 hours. During the same period, its trading volume declined by 25%, indicating reduced participation from traders and investors compared to the previous day.
Credit: Source link


