Ranking among the top 5 cryptocurrencies, Solana has a market cap of $61.96 billion. The altcoin has surged 4.22% in the past 24 hours and is currently trading at $132.73.
Following the recent bear cycle, the minor recovery is sparking optimistic speculations. So, will the recent recovery in Solana lead to a new bull cycle, or is a downfall imminent?
Solana Holds $125 Bullish Fort.
Surviving the rumors of a massive dump from FTX, Solana ended 2023 with the Solana Mobiles, Saga, being sold out. Further, the Bonk (BONK) meme coin fueled the rally with the Saga phone promotion by an airdrop of 30 million BONK tokens.
In 2024, Solana turned a high-volume zone into a support zone with a breakout rally in March, as Solana flipped Ethereum to become the number one blockchain in weekly stablecoin transfer volume.
 Source: Trading View
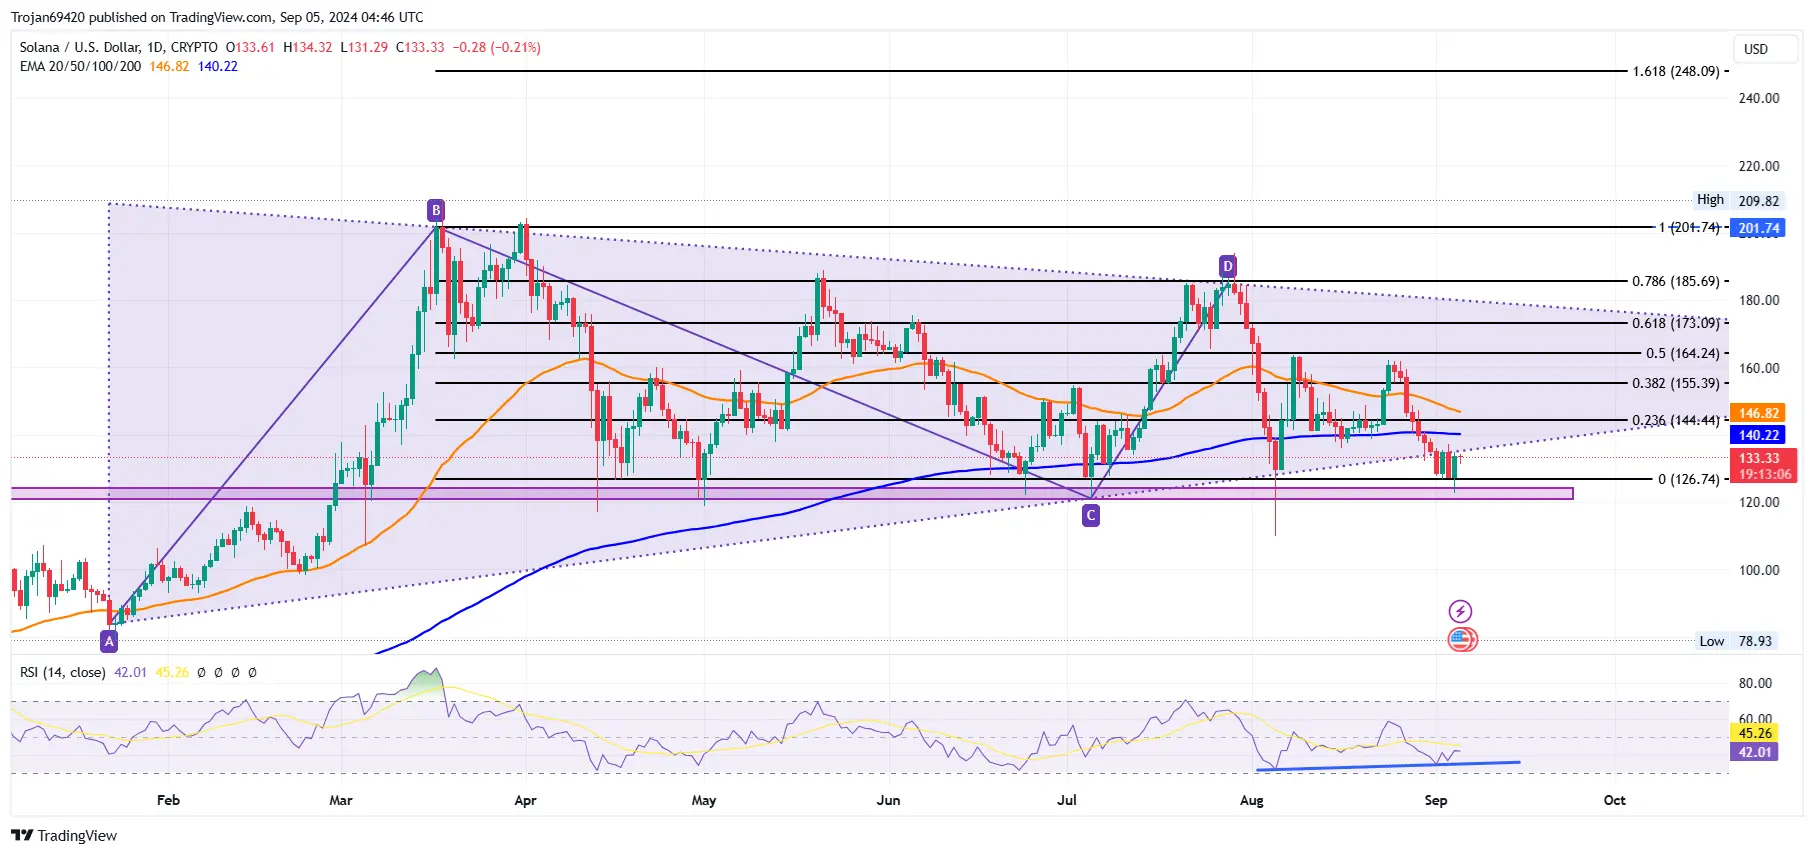
Currently, the Solana price action in the daily chart reveals a new bear cycle within a large symmetrical triangle from the $165 peak. The selling spree takes a sideways shift near the crucial support of $126. Further, a demand zone supports the $126 level, extending between $120 and $125.
With a highly volatile trend, the Solana price managed to end yesterday at 4.75%, but the intraday pullback of 0.74% reveals a minor exhaustion in bullish powers.
The 50-day and 200-day EMA maintains a sideways trend with a growing bearish influence, warning of a death cross event. Furthermore, despite the constant support at $125, the Solana price action reveals a symmetrical triangle breakdown.
The Three Intense Solana Bear Cycle of 2024
Based on the Fibonacci levels, the $200 provided a double-top reversal. Similarly, the 78.60% level at $185 resulted in the second double-top reversal despite the filing for Solana ETFs by 21Shares and VanEck.
Amid the intense eight-day crash, the Spot Solana ETF approval in Brazil failed to reverse the trend.
Finally, the 50% Fibonacci level at $164 resulted in the third. However, the bearish reversals have yet to be able to break below the $125 mark.
Will Solana Bounce Back?
Currently, the triangle breakdown rally unsurprisingly finds support at the $126 mark and reveals a retest phase. However, the bulls will likely push back into the triangle pattern if the broader market stabilizes or recovers.
Supporting this bullish thesis, the divergence in the RSI line in the last two bottom formations projects a potential reversal rally. Hence, a potential bounceback can test the resistance levels at the 23.60% and 38.20% Fibonacci levels at $144 and $155, respectively.
Conversely, considering a death cross event occurs between the 50- and 200-day EMA, the increased bearish influence could result in an extended correction. In such a case, the next support levels below the $120 mark are at $110 and the $100 psychological mark.
Credit: Source link


