Join Our Telegram channel to stay up to date on breaking news coverage
The Synthetix prediction price shows that SNX is changing hands at $2.31 as the technical indicator Relative Strength Index (14) crosses above the 60-level.
Synthetix Prediction Statistics Data:
- Synthetix price now: $2.31
- Synthetix market cap: $592 million
- Synthetix circulating supply: $264.3 million
- Synthetix total supply: $320.5 million
- Synthetix coin market ranking: #66
SNX/USD Market
Key Levels:
Resistance levels: $3.00, $3.10, $3.20
Support levels: $1.50, $1.40, $1.30
SNX/USD is currently trading around $2.31 and once it manages to surpass the potential resistance of $2.39, the next target could be located at $2.40 where it trades above the 9-day and 21-day moving averages. However, a push from here could send the price straight above the upper boundary of the channel as the daily low could be spotted at the $2.01 support level. If the current level fails to hold strong, the Synthetix (SNX) could slip below the 9-day and 21-day moving averages.
Synthetix Price Prediction: Would Synthetix Move Upward?
Looking at the daily chart, the Synthetix bulls are now coming back into the market. Therefore, if the buyers can put more effort and push the market price above the upper boundary of the channel, SNX/USD may likely hit the resistance levels of $3.00, $3.10, and $3.20 respectively. In addition, any bullish movement above these key resistance levels may likely encourage further buying.
Moreover, a break toward the lower boundary of the channel may bring the coin toward the critical supports at $1.50, $1.40, and $1.30. Meanwhile, looking at the technical indicator Relative Strength Index (14), Synthetix may exhibit the tendencies to follow an upward trend as the signal line moves toward the 60-level, suggesting that the market may head to the upside.
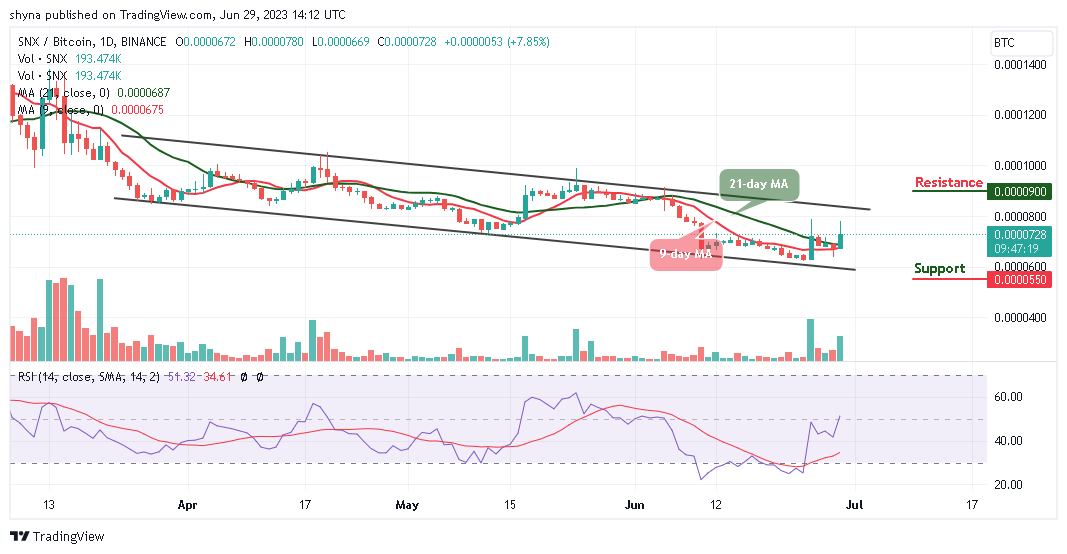
When compares with Bitcoin, the Synthetix price is hovering above the 9-day and 21-day moving averages which may be the nearest resistance at 800 SAT. Therefore, unless this resistance effectively holds and the price ends up closing above it, there might not be any reason to expect a long-term bullish reversal.

On the contrary, bringing the price toward the lower boundary of the channel could refresh lows under 600 SAT as a possible bearish continuation may likely hit the major support at 550 SAT and below. Moreover, the buyers may push the coin to the potential resistance at 900 SAT and above as the technical indicator Relative Strength Index (14) crosses above the 50-level, suggesting more bullish signals.
Alternatives to Synthetix
The Synthetix price may continue to rise and could probably cross the channel if the bulls could increase the buying pressure. However, any further bullish movement above the upper boundary of the channel may locate the potential resistance level at $2.5.
Meanwhile, Wall Street Memes Token ($WSM) stands tall among other meme coins thanks to a well-defined roadmap and clear vision. The token has raised close to $12 million in the presale and many analysts expect the token value to explode at this stage, securing a high ROI for all investors involved.
Wall Street Memes – Next Big Crypto
- Early Access Presale Live Now
- Established Community of Stocks & Crypto Traders
- Featured on BeInCrypto, Bitcoinist, Yahoo Finance
- Rated Best Crypto to Buy Now In Meme Coin Sector
- Team Behind OpenSea NFT Collection – Wall St Bulls
- Tweets Replied to by Elon Musk
Join Our Telegram channel to stay up to date on breaking news coverage
Credit: Source link


